- Products ProductsLocation Services
Solve complex location problems from geofencing to custom routing
PlatformCloud environments for location-centric solution development, data exchange and visualization
Tracking & PositioningFast and accurate tracking and positioning of people and devices, indoors or outdoors
APIs & SDKsEasy to use, scaleable and flexible tools to get going quickly
Developer EcosystemsAccess Location Services on your favorite developer platform ecosystem
- Documentation
- Pricing
- Resources ResourcesTutorials TutorialsExamples ExamplesBlog & Release Announcements Blog & Release AnnouncementsChangelog ChangelogDeveloper Newsletter Developer NewsletterKnowledge Base Knowledge BaseFeature List Feature ListSupport Plans Support PlansSystem Status System StatusLocation Services Coverage Information Location Services Coverage InformationSample Map Data for Students Sample Map Data for Students
Search Application Logs
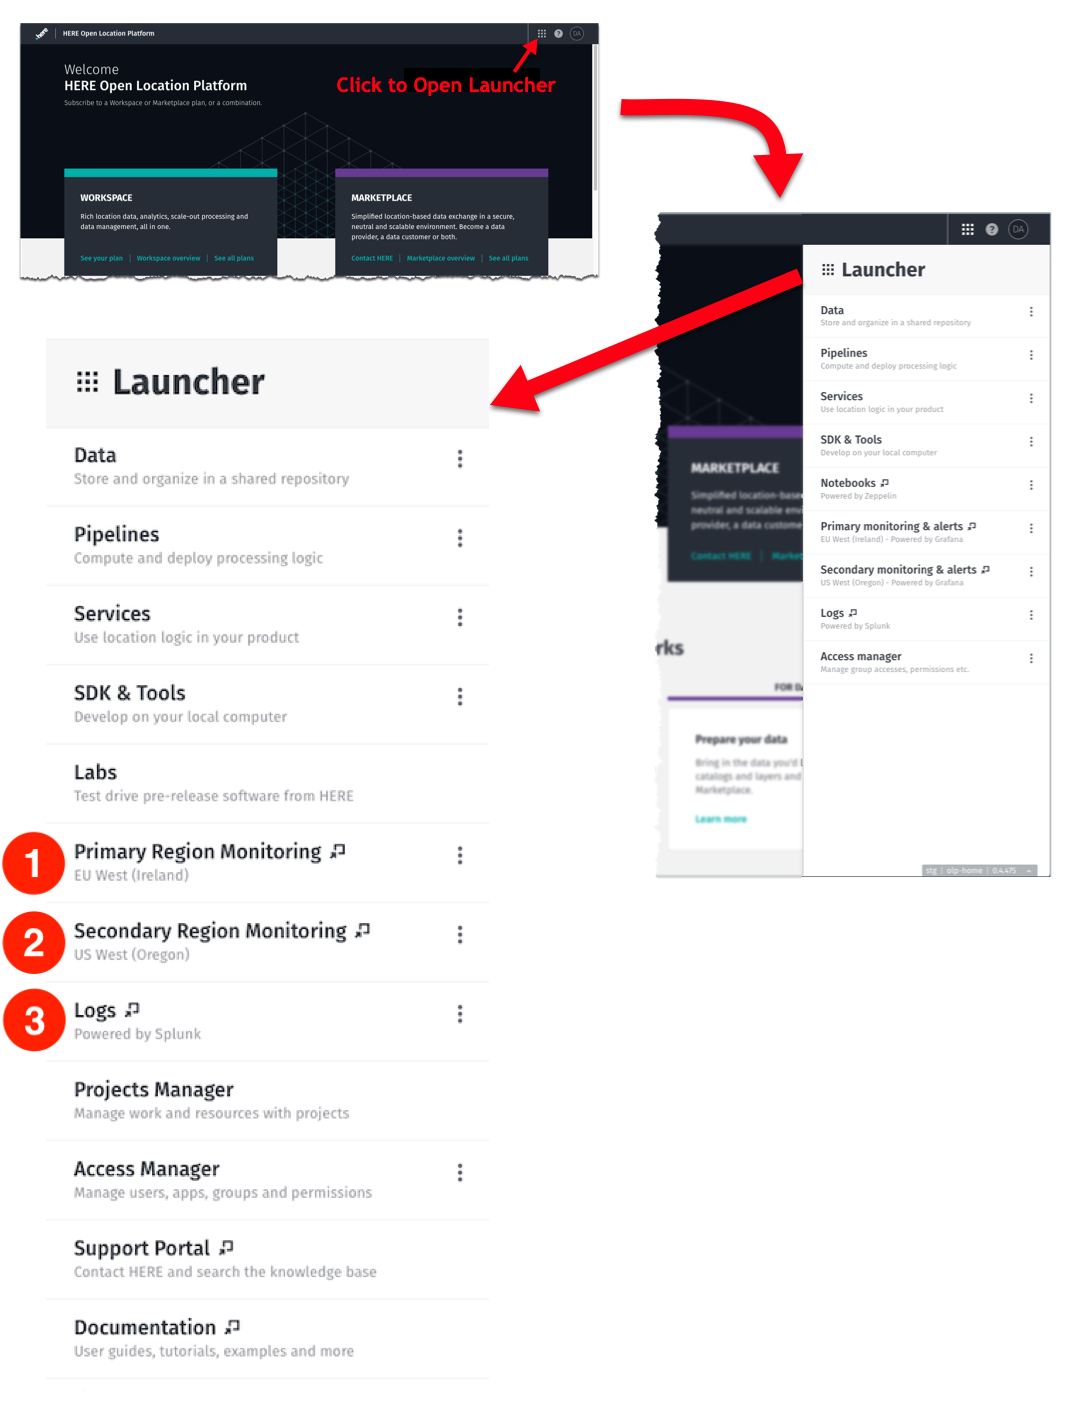
Application logs can be accessed through Splunk. To start a new search, open the Launcher menu from the HERE platform portal and click on Logs (see menu item 3 in Figure 1).

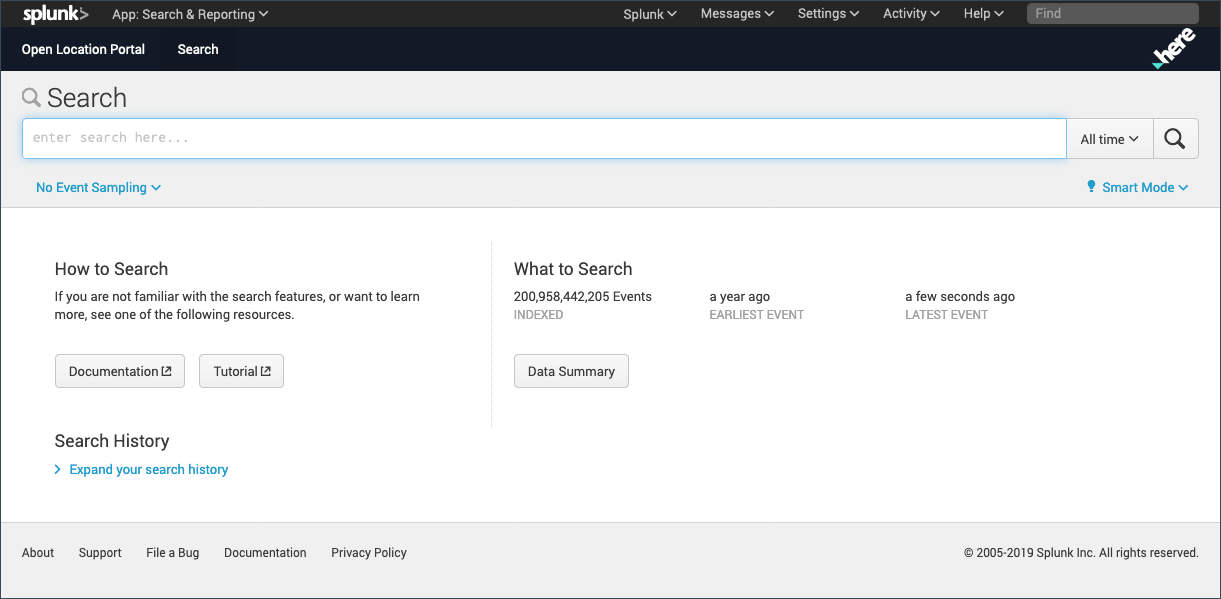
The Splunk home page opens and you can begin by entering a search term and starting the search. For more information on performing a Splunk search, see the official Search Tutorial.

One limitation of starting this way is that you have access to all of the log data for all pipelines. Thus, you will have to specify a search term that includes identification of the pipeline or job of interest. Alternately, you can access a running pipeline's logs directly as shown in Figure 3. This is done from the platform portal information display for a running pipeline.

Note: Single log line size limit
Any single log line exceeding the allowed limit of 900 KB will be discarded and will not be available in Splunk.
For more information on using Splunk, see the tutorials in the Splunk documentation.
For more information on configuring log levels in a pipeline, see the Pipelines Developer Guide.
Pipeline Log Index
Pipeline logs are stored in the olp-<realm>_common index. For example, if your account is in the olp-example realm, your index would be olp-example_common. You can search for this by adding the following string to your Splunk search query:
index="olp-example_common"
Troubleshoot Pipeline Issues
You can use application logs to debug and troubleshoot pipeline issues.
During the pipeline setup (before it is submitted to be run), the pipeline service does not produce any logs. Any feedback is provided only through the Pipeline service APIs.
Once a pipeline job is submitted, the errors can happen in two different scnearios: before and after the pipeline has started running.
Before the Pipeline Starts Running
There are a number of steps that the pipeline goes through before it actually starts running. Any errors at this point are not attached to a job. These errors are first captured internally by the platform, and then pushed out to your appropriate Splunk index. Only error logs related to your pipeline can appear in your specific Splunk index.
To search your Splunk index for these logs, use the pipeline or pipeline version UUID.
Once the Pipeline Starts Running
Once the pipeline starts running, there is a corresponding job reported in Pipeline Version Details on the HERE platform portal and Pipelines API responses. Each pipeline job is assigned a link to the logs for that job run.
Note: Time Window Expiration
The default time window built into the link expires after some time. For example, the default link may be pulling logs from the last 15 minutes. This link does not work on the next day.
To search for these logs again, select a time window using Splunk. You can do this through a drop-down list option at the top right of the Splunk UI.