- Products ProductsLocation Services
Solve complex location problems from geofencing to custom routing
PlatformCloud environments for location-centric solution development, data exchange and visualization
Tracking & PositioningFast and accurate tracking and positioning of people and devices, indoors or outdoors
APIs & SDKsEasy to use, scaleable and flexible tools to get going quickly
Developer EcosystemsAccess Location Services on your favorite developer platform ecosystem
- Documentation
- Pricing
- Resources ResourcesTutorials TutorialsExamples ExamplesBlog & Release Announcements Blog & Release AnnouncementsChangelog ChangelogDeveloper Newsletter Developer NewsletterKnowledge Base Knowledge BaseFeature List Feature ListSupport Plans Support PlansSystem Status System StatusLocation Services Coverage Information Location Services Coverage InformationSample Map Data for Students Sample Map Data for Students
Standard Dashboards
A selection of Standard dashboards has been provided in Grafana for your convenience.
Grafana
The Grafana home page includes a list of available dashboards as shown in Figure 1.
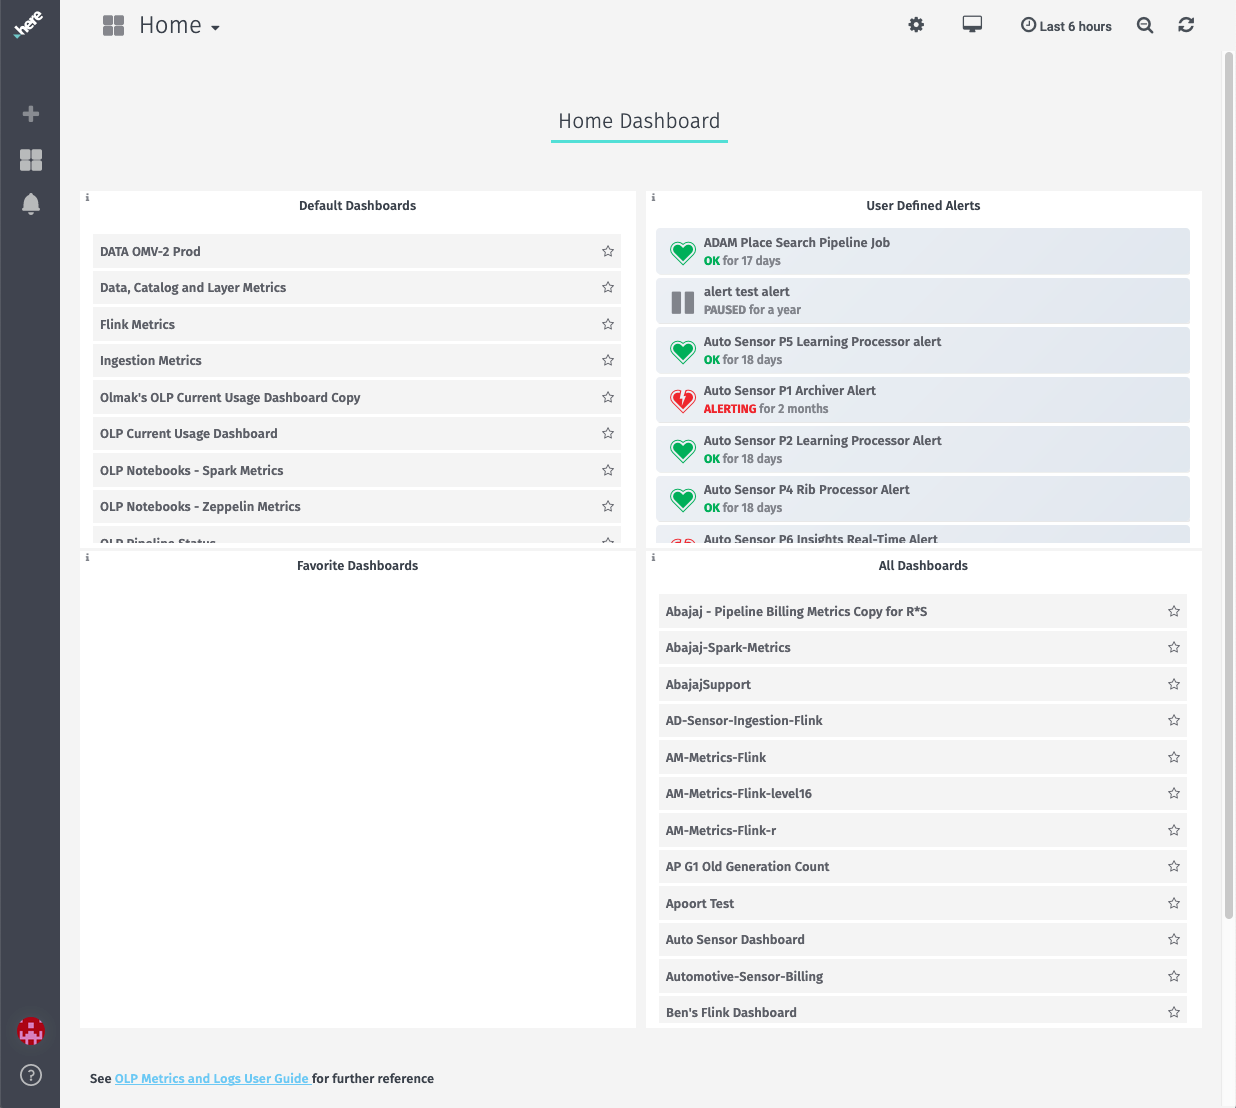
Default dashboards available for HERE Workspace include the following.
| Name | Description |
|---|---|
| Data, Catalog and Layer Metrics | A report of all catalog activity during the most recent 24 hours. |
| Ingestion Metrics | Reports on all data ingestion activities by catalog and layer. |
| HERE Workspace Current Usage Dashboard | Shows all current data resources and pipelines running in HERE Workspace. |
| Pipeline Status | A summary of pipeline jobs and their status. |
| Spark Metrics | Reports on Spark system usage metrics. |
| Flink Metrics | Reports on Flink system usage metrics. |
| HERE Notebooks - Spark Metrics | Reports on cluster metrics during process execution from within the HERE Notebook. |
| HERE Notebooks - Zeppelin Metrics | Reports on general metrics (excluding cluster metrics) during process execution from within the HERE Notebook. |
In Grafana, it is possible to copy the default dashboards or create new dashboards.
Note: Data Availability
The data for metrics in Grafana is stored for last 30 days only. So, selecting time ranges greater than 30 days from Grafana will result in inaccurate metrics.