- Products ProductsLocation Services
Solve complex location problems from geofencing to custom routing
PlatformCloud environments for location-centric solution development, data exchange and visualization
Tracking & PositioningFast and accurate tracking and positioning of people and devices, indoors or outdoors
APIs & SDKsEasy to use, scaleable and flexible tools to get going quickly
Developer EcosystemsAccess Location Services on your favorite developer platform ecosystem
- Documentation
- Pricing
- Resources ResourcesTutorials TutorialsExamples ExamplesBlog & Release Announcements Blog & Release AnnouncementsChangelog ChangelogDeveloper Newsletter Developer NewsletterKnowledge Base Knowledge BaseFeature List Feature ListSupport Plans Support PlansSystem Status System StatusLocation Services Coverage Information Location Services Coverage InformationSample Map Data for Students Sample Map Data for Students
Coverage Data
CoverageDataSource gives you an insight into the geographic coverage of the data that you load. CoverageDataSource works in combination with other data sources. For example, you could combine it with SDII data about road signs. You can then see which parts of the map are covered by your SDII data. The coverage is rendered as tiles in a grid that is overlaid on top of the base map.
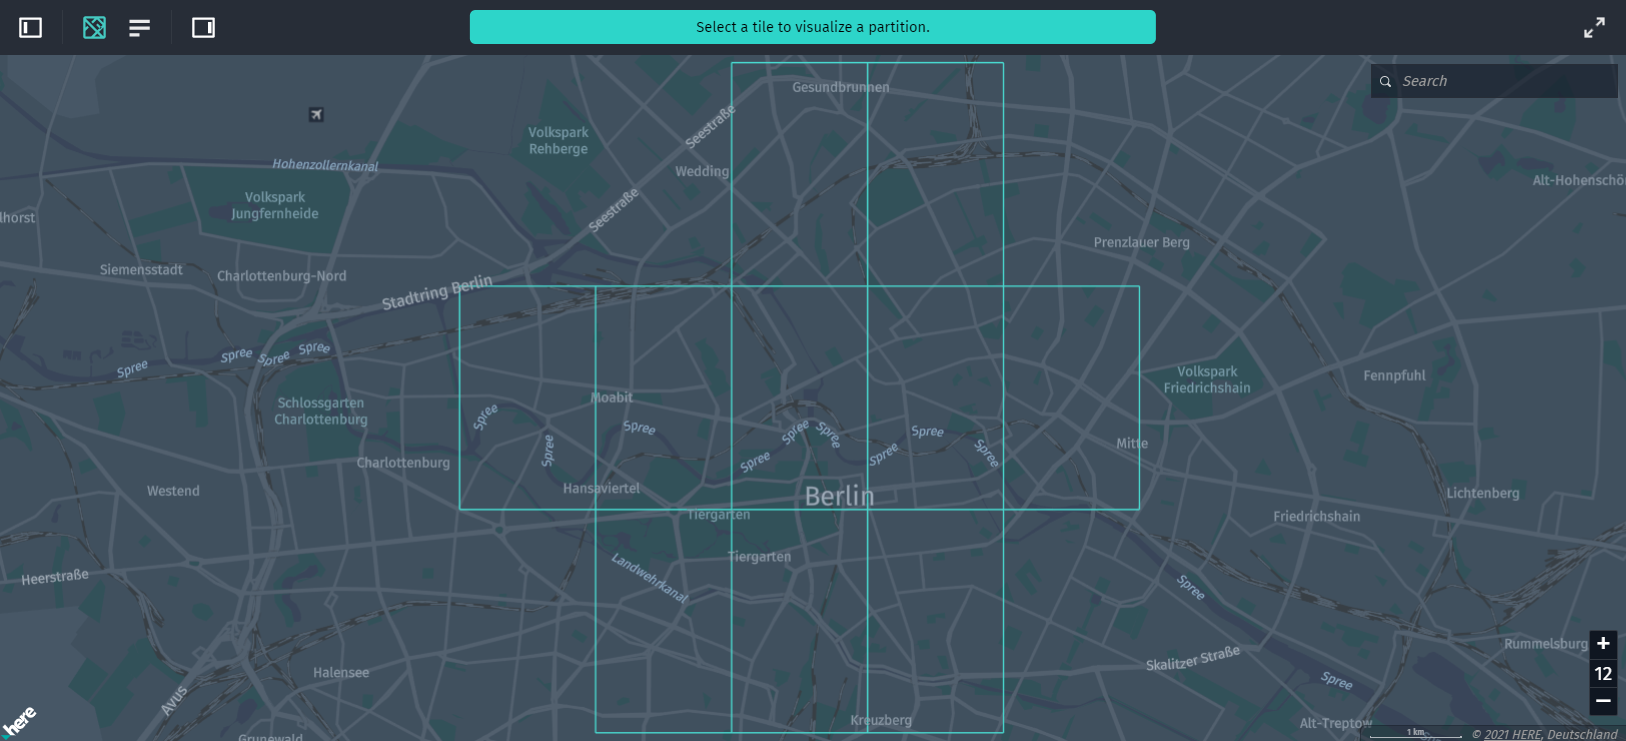
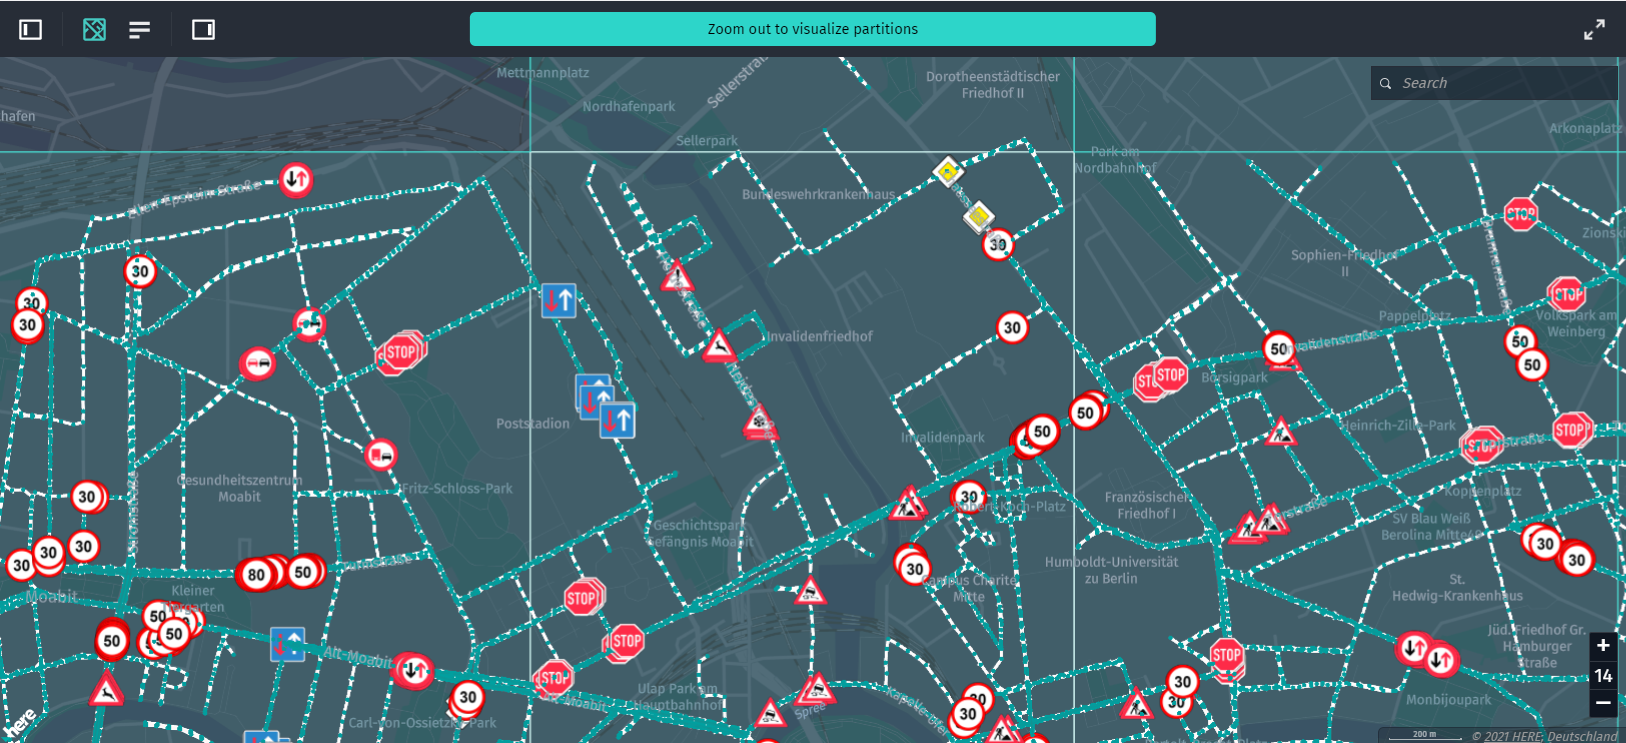
Each tile represents an area that is covered by your data such as road sign data. You can click a tile for the Library to load the actual data to the tile. In the case of road sign data, you can see the road sign icons rendered on the map that are contained in the tile you clicked.
CoverageDataSource renders the tile grid at four zoom levels higher than the level where the data is stored. You can use it to visualize tiles with the data that has already been loaded.
You can use this data source to style tiles when selected or deselected by a user and to highlight the tiles when the mouse pointer is moved over them.
For example, if you point the coverage data source to the same catalog as the SDII data source, CoverageDataSource visualizes any tiles containing SDII data.
To see the coverage data source in action, update your code as follows:
const coverageDataSource = new CoverageDataSource({
    dataSource: {
        hrn: HRN.fromString("Your HRN string"),
        layer: "Layer name where SDII data is stored",
        getBearerToken: () => Promise.resolve("Your Token")
    },
    levelWithData: 14 // grid will be rendered for specified tiles level
});
mapView.addDataSource(coverageDataSource);