- Products ProductsLocation Services
Solve complex location problems from geofencing to custom routing
PlatformCloud environments for location-centric solution development, data exchange and visualization
Tracking & PositioningFast and accurate tracking and positioning of people and devices, indoors or outdoors
APIs & SDKsEasy to use, scaleable and flexible tools to get going quickly
Developer EcosystemsAccess Location Services on your favorite developer platform ecosystem
- Documentation
- Pricing
- Resources ResourcesTutorials TutorialsExamples ExamplesBlog & Release Announcements Blog & Release AnnouncementsChangelog ChangelogDeveloper Newsletter Developer NewsletterKnowledge Base Knowledge BaseFeature List Feature ListSupport Plans Support PlansSystem Status System StatusLocation Services Coverage Information Location Services Coverage InformationSample Map Data for Students Sample Map Data for Students
Inspect Multiple Layers
The Data Inspector allows inspecting up to 4 datasets at the same time. You can add either layers from the platform or upload local partitions. Not only you can inspect different layers, but also a few versions of the same layer simultaneously.
You can use this functionality to visually debug your pipelines by rendering the pipeline output in the portal and having it overlaid with the input layer(s).
Data Setup
To set up your data:
-
In the Control Panel, click the Add Layer button:

-
In the dialog box that opens, choose the source of the data to inspect - Platform or Local File.

-
For Platform, specify the catalog HRN and layer ID.

-
For Local File, upload a partition from your local machine.

By default, the Data Inspector attempts to detect the schema and the rendering plugin (if available) that are bundled with the layer.
-
To select another schema, click the close button (
 ) next to Schema and specify the schema HRN.
Note that you can always restore the default schema from the layer.
-
Or, click Local File and upload a custom schema from your local machine.

The plugin (if available) is loaded automatically.
-
To change the default rendering plugin, click the close button (
) and upload a custom plugin from your local machine.
Note that you can always restore the default plugin from the schema.
-
Click Add data.
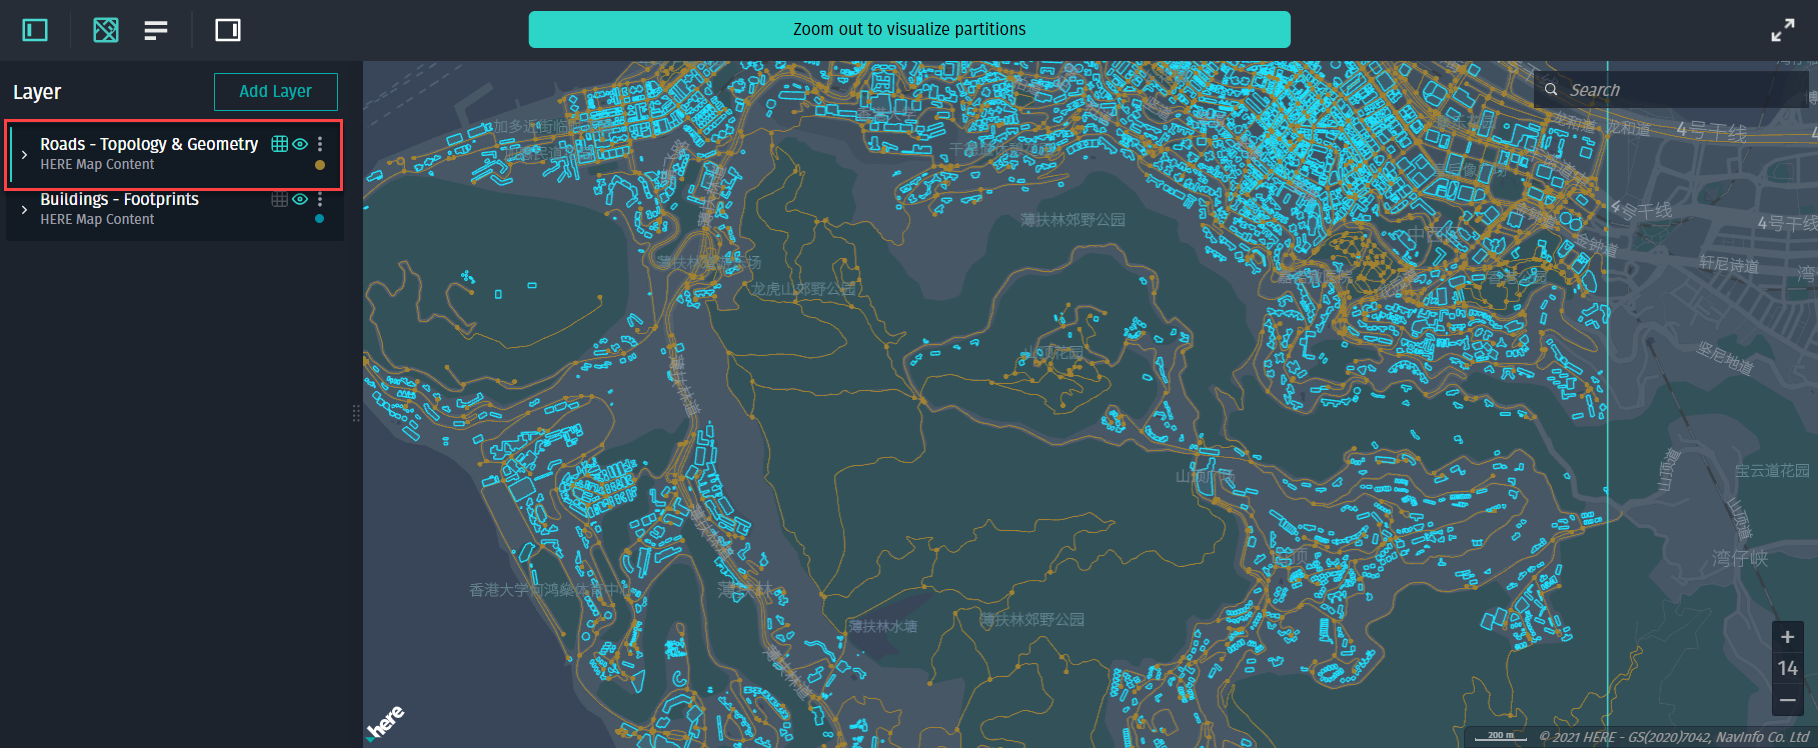
The Roads - Topology & Geometry layer is added to the Layer section of the Control Panel.

Use the options ( ) button next to the layer name to reconfigure or remove the layer from the Control Panel.

Note
If you are inspecting a specific layer in the Inspect tab on the platform, you cannot reconfigure or remove that layer as it is considered as primary.
Inspection Options
- Layer Selection
- Data Visualization
- Layer Order
- Coverage Map
- Styling
- Compare Different Versions of the Same Layer
Layer Selection
With two or more layers added to the Control Panel, only one layer is always selected (marked with a green vertical line).
For a selected layer, these controls are enabled:
- Coverage tile grid
- Partitions list
Data Visualization
When you click a tile to visualize it, data from the selected layer is rendered.
To visualize several layers in one tile, select another layer in the Control Panel and click the same tile again. Each consecutive dataset is overlaid on top of the previous visualization.
In the example below, we first visualized road geometry data, then we selected the Buildings - Footprints layer and clicked the same tile:

Use Ctrl(Cmd)+click to select/deselect multiple tiles.
To quickly show or hide visualized data for a layer, click the eye button ( ) next to that layer.
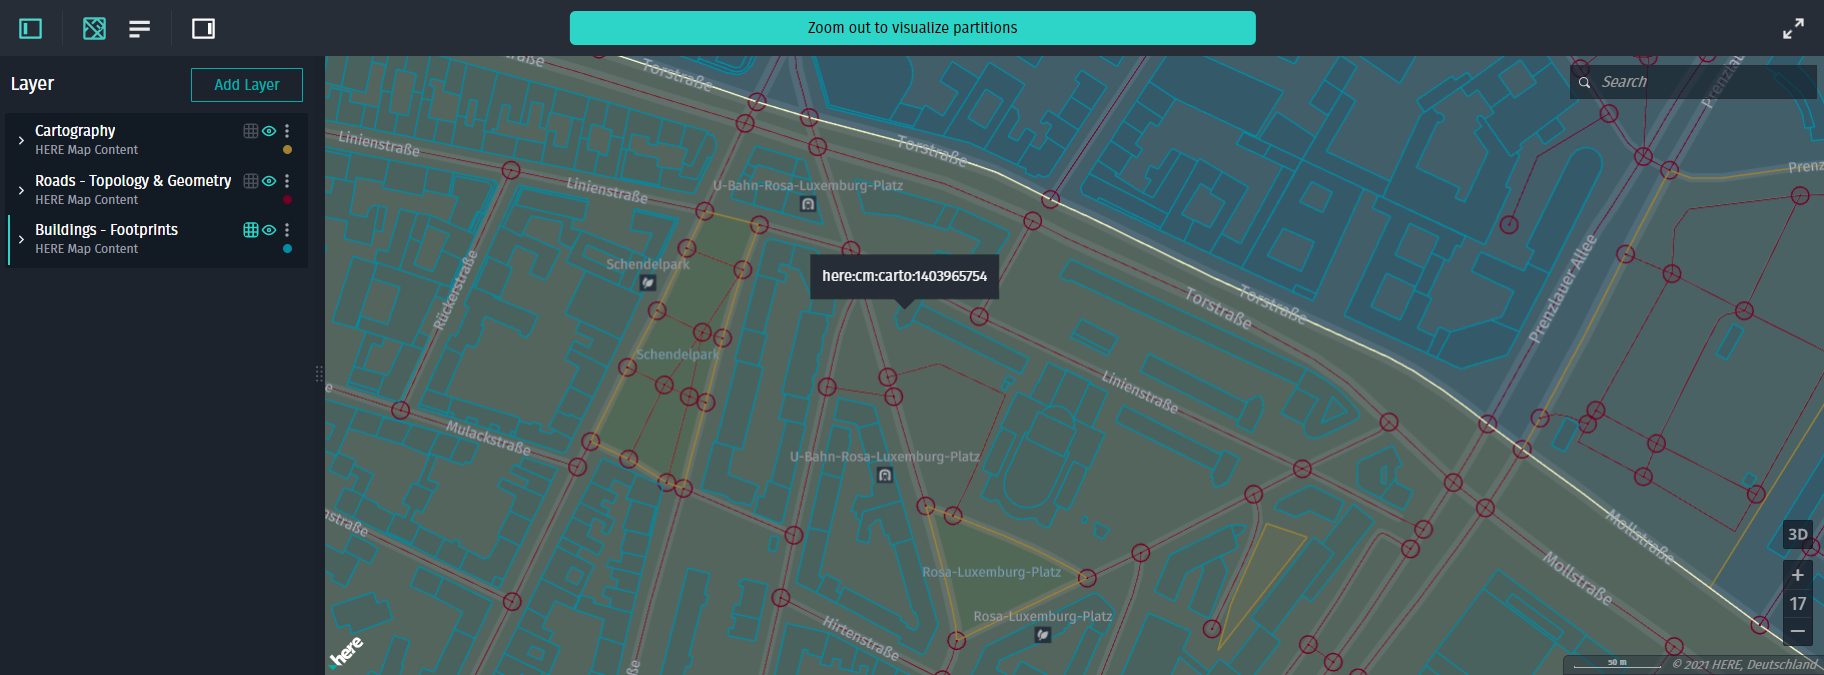
Layer Order
Layers in the Control Panel are ordered according to how you add them (the last added is the first in the list). Thus, when you are clicking through overlaid features from different layers, the features are selected based on the layer order.
For instance, in the figure below, the first layer is Cartography. That is why, cartographic features are first selected when you click what seems to be a building. The building, in it's turn, is selected when you click it the second time.
Coverage Map
When inspecting multiple layers, you can click the tile grid ( ) button to choose for which layer to show or hide the tile grid. Note that the tile grid can be enabled only for one layer.
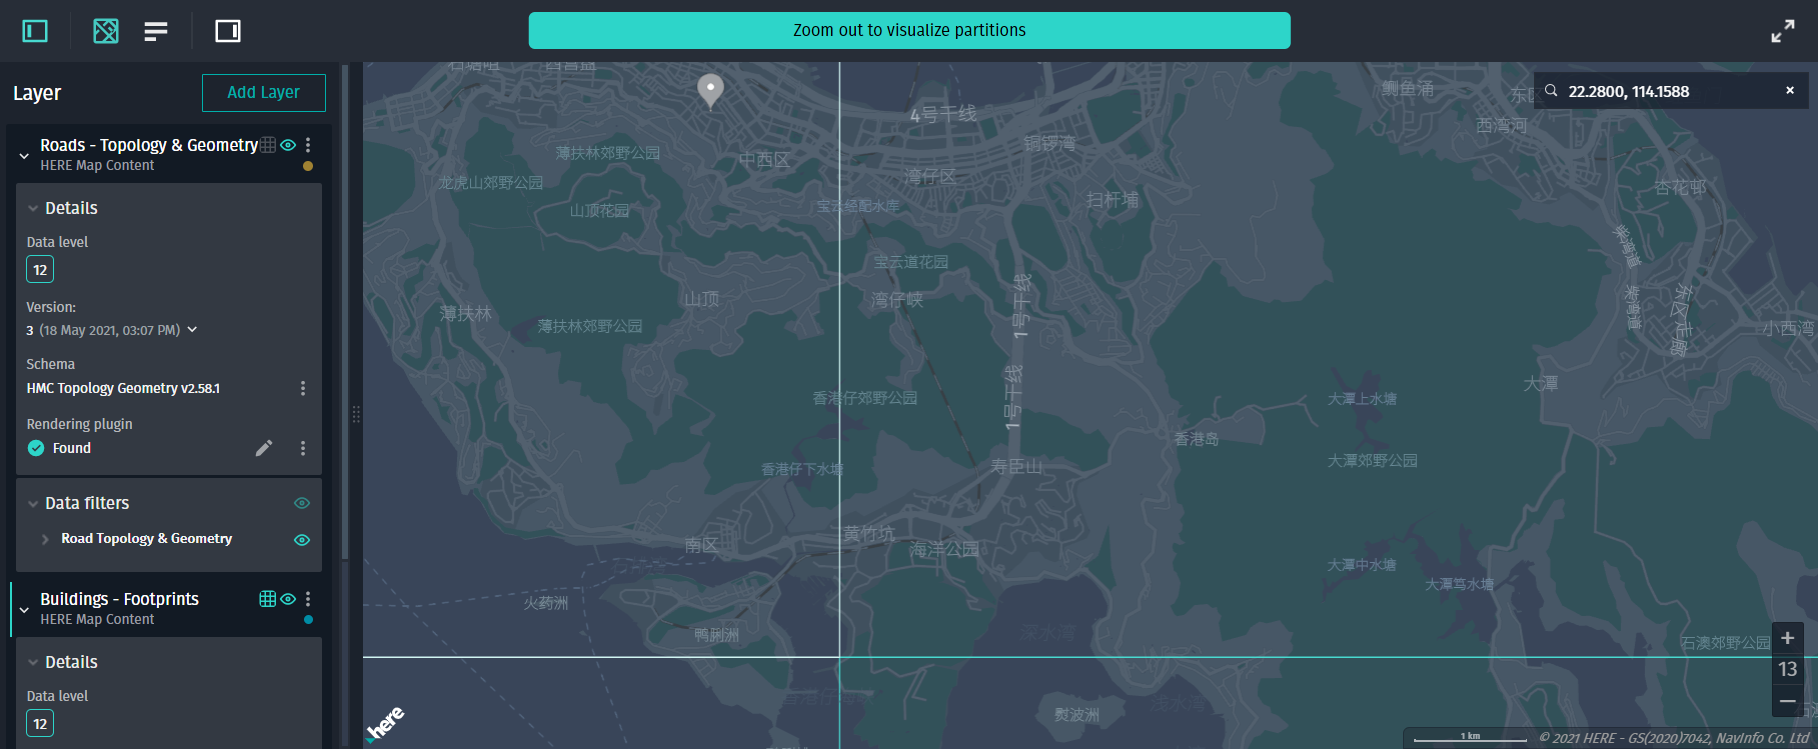
You can remove the tile grid from all the layers in the list to reduce map noise.
Styling
For a clear vision of what layer (or layer version) a visualized feature is part of, you can use a preset color palette to style the visualization of each dataset.
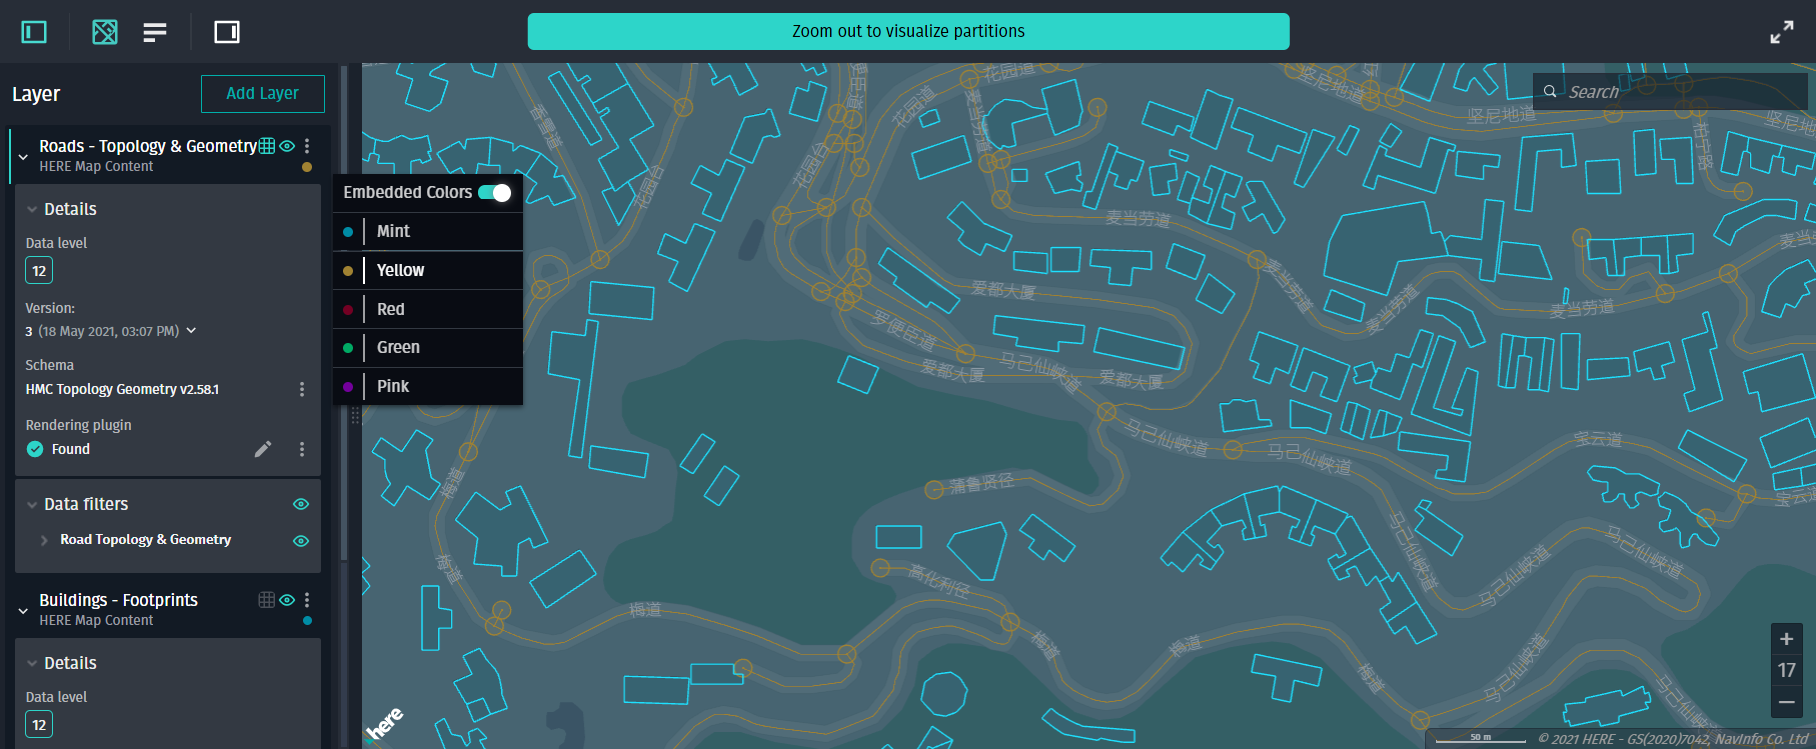
To show the data with the colors that are defined in the rendering plugin, disable the Embedded Colors switcher.
Compare Different Versions of the Same Layer
To compare different versions of the same layer:
-
Add the same layer twice or more.
-
In the Control Panel, select the desired versions for each layer.

Now you can inspect how the data changed between the two versions of the same layer.