- Products ProductsLocation Services
Solve complex location problems from geofencing to custom routing
PlatformCloud environments for location-centric solution development, data exchange and visualization
Tracking & PositioningFast and accurate tracking and positioning of people and devices, indoors or outdoors
APIs & SDKsEasy to use, scaleable and flexible tools to get going quickly
Developer EcosystemsAccess Location Services on your favorite developer platform ecosystem
- Documentation
- Pricing
- Resources ResourcesTutorials TutorialsExamples ExamplesBlog & Release Announcements Blog & Release AnnouncementsChangelog ChangelogDeveloper Newsletter Developer NewsletterKnowledge Base Knowledge BaseFeature List Feature ListSupport Plans Support PlansSystem Status System StatusLocation Services Coverage Information Location Services Coverage InformationSample Map Data for Students Sample Map Data for Students
Development Environment
The Data Inspector provides rendering settings and an embedded JS editor that you can use to develop your custom rendering plugin code with platform data or local partition files.
Develop Plugins with Local Partition File
The Data Inspector online standalone tool provides a wizard that helps you set up your data to start developing rendering plugins with a local partition file:
-
In the Layer panel, click Add layer.

-
In the form that opens, upload a local partition file. You can add any partition type supported by the platform.

-
Then, upload a local schema file (
.zip) or specify the HRN of a schema hosted on the platform.
-
If your schema already contains a rendering plugin file (
.js), click Add data. The plugin file is detected automatically.
-
If you have a local plugin file, then upload it to the wizard and click Add data.

Note
In case a plugin is found in the attached schema, and you explicitly add a local plugin, the plugin from the schema is ignored. The plugin you upload from your local machine is used for rendering partition data.
You can start developing and testing your plugin. For info on how to use the controls in the Details panel, see the chapter below.

You can always change your initial data setup. For this, click the more (three dots) menu to the left of the local partition ID and click Edit or Remove.

Note
When developing plugins with local partitions, keep in mind that the uploaded partition, schema, and renderer plugin are temporarily stored in memory and not connected to the platform. That is why, the rendering functions getGeoJSON and getGeoJSONAsync should be used a bit differently:
- The
params.layerproperty doesn’t contain the object of the real layer, which is going to be available when the plugin is published in the platform Data Service. - The
params.getDependencies()function doesn’t provide dependencies. - For the
params.getPartitionDataProvider()function, pass thecatalogHrnparameter to let the Data Inspector know what catalog to connect to.
Develop Plugins with Platform Data
You can use both local and platform Data Inspector tools to write rendering plugins for the data stored on the platform.
First, you need to configure layer rendering settings - add a schema and a rendering plugin. Both local and platform-hosted schemas and plugins are supported. Then open the JS editor and start writing your code.
For more details, see the chapters below.
Configure Rendering Settings
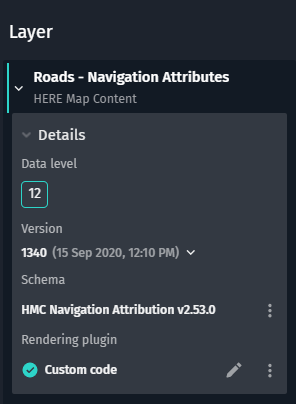
The Layer section in the Data Inspector's Control Panel allows you to work with layer schemas and rendering plugins:
Layer rendering settings are available for the following cases, depending on a layer's partitioning scheme and content type:
- For all HERETile layers, rendering settings are available for layers of any content type.
- For HERETile layers of content type
application/geo+jsonorapplication/vnd.geo+json, you can customize visualizations of GeoJSON data through a rendering plugin (highlight features, provide custom icons, apply tooltips, and more). - For HERETile layers that originally have no bundled schema, you can provide your own schemas for data decoding.
- For generic layers, rendering settings are enabled, including those whose content type is
application/x-protobuf. As for the latter, you can use your own schemas for data decoding.
Add Schema
The Schema field shows the data schema that is currently assigned to a catalog layer.
By default, the original schema assigned to a catalog layer is loaded, along with the bundled rendering plugin (if available).
You can load your custom data schemas as a ZIP archive by clicking the More button on the right and selecting Open schema.
If you load a schema without a rendering plugin, no data is visualized, and the Rendering plugin field shows Missing. To fix this, you can do one of the following:
-
Develop your own rendering plugin: For this, click the Create plugin button to open the editor and type your code.
-
Reset your custom schema: For this, click the More button and select Reset to load the original schema assigned to the selected layer.
-
Load another data schema with a bundled rendering plugin.
Develop Rendering Plugin
The Rendering plugin field informs you about the rendering plugin that is currently applied for the selected data schema:
-
Found: A rendering plugin has been detected in the currently loaded schema and applied.
-
Custom code: The currently loaded rendering plugin has been modified.
-
Missing: No rendering plugin bundled with the currently loaded schema has been found.
The editor enables you to load your local plugin JS file into the Data Inspector to run it on the layer data that has been already loaded into the Data Inspector. For this, click the More button on the right and select Open plugin. To return to the rendering plugin bundled with the currently loaded schema, select More > Reset.
To modify your plugin code, click the Edit plugin button to open the embedded editor. Once satisfied with the results, you can download the modified JS file to save your code by selecting More > Download.
Embedded JS Editor
You can open the plugin code editor by clicking the Create/Edit plugin button in the Rendering plugin section.

This is a rich JavaScript editor offering:
- Extended code-editing functionality
- Live JS syntax highlighting
- JS file drag-and-drop
- Code auto-completion
- Syntax error indication
If you create a rendering plugin from scratch, the editor contains a plugin template with detailed inline instructions. To see a sample implementation of the Data Inspector Library rendering functions and style properties, see Plugin Examples and Style GeoJSON Visualization.

You can also drag-and-drop your local plugin JS file directly into the editor area. In this case, the file is loaded into the browser memory for the duration of the catalog connection session.
To launch your plugin code, click the Run button above. The layer data is rendered in the Data Inspector Library map view. Once satisfied with the results, you can download the modified JS file to save your code with the Download button).
While developing your plugin, any errors that may occur can be viewed in your browser's developer tools.
Note: Restoring Unsaved Plugin Code
The rendering plugin editor automatically saves your plugin code to your browser's local storage. So, in case of browser crash, or if you accidentally leave or reload the plugin editor page with unsaved changes, you can restore your code from the previous session. The browser additionally prompts you about unsaved changes in case you reload or leave the plugin editor page.
Debugging
You can debug rendering plugin code with your browser's built-in developer tools. To launch developer tools on most popular browsers, use the Ctrl(Cmd)+Shift+J shortcut.
Because plugin code and its evaluated object are not accessible through a global scope object or the <script> tag, you need to add debugger statements to those lines in code on which you want the debugger to pause execution. After you open developer tools and rerun the plugin code (by selecting a new tile or clicking Run), the browser starts debugging at the first active breakpoint it encounters. For more information on the JS debugger statement, see MDN Web Docs.
Note
Each time you update the code, the rendering plugin object is dynamically recreated by the Data Inspector Library with the JS eval function. That is why, if you manually place breakpoints at certain lines using a browser's developer tools, the breakpoints become invalid after you update the plugin code. Only breakpoints created with debugger statements persist, so make sure that you remove them in the production version of your plugin code.