- Products ProductsLocation Services
Solve complex location problems from geofencing to custom routing
PlatformCloud environments for location-centric solution development, data exchange and visualization
Tracking & PositioningFast and accurate tracking and positioning of people and devices, indoors or outdoors
APIs & SDKsEasy to use, scaleable and flexible tools to get going quickly
Developer EcosystemsAccess Location Services on your favorite developer platform ecosystem
- Documentation
- Pricing
- Resources ResourcesTutorials TutorialsExamples ExamplesBlog & Release Announcements Blog & Release AnnouncementsChangelog ChangelogDeveloper Newsletter Developer NewsletterKnowledge Base Knowledge BaseFeature List Feature ListSupport Plans Support PlansSystem Status System StatusLocation Services Coverage Information Location Services Coverage InformationSample Map Data for Students Sample Map Data for Students
Add Tooltips and Styles
GeoJSON objects can have arbitrary custom data in the properties members of GeoJSON features. This can be used to display additional information for objects and to apply custom styles.
Add Tooltips and Info Panels
To display custom information from a GeoJSON feature, you can set values for tooltip and description of the feature's properties property. tooltip is used to render a short tooltip shown when the mouse pointer is placed over the feature, and description is used to contain more detailed information shown by clicking the feature.
tooltip and description are rendered by the InfoTooltip and InfoPanel UI components. The contents of these components is updated by InteractiveIntersectionAgent, which translates the mouse pointer coordinates to 3D space and checks whether the pointer intersects any object in the connected data source. If there is an object underneath the pointer, an event is fired and received by an instance of InfoPanel and InfoTooltip, which displays information from the properties member of GeoJSON objects.
To add a tooltip and info panel, you should first add these new imports to the import section of index.ts:
import { InteractiveIntersectionAgent } from "@here/interactive-datasource-protocol";
import { InfoPanel } from "@here/interactive-mapview-ui";
Then, add code to attach InteractiveIntersectionAgent to the data source instance and initialize InfoPanel and InfoTooltip. This is done by adding the GeoJsonDataSource.EVENT_ATTACHED event listener to the existing createGeoJsonDataSource function. The event handler will have the code to initialize the intersection agent and UI widgets:
function createGeoJsonDataSource() {
    const geoJsonDataSource = new GeoJsonDataSource({});
    geoJsonDataSource.addEventListener(
        GeoJsonDataSource.EVENT_BEFORE_TILE_RENDERED,
        (event: GeoJsonDataSourceEvent) => {
            const boundingBox = event.boundingBox;
            if (dataInspector.mapView === undefined || boundingBox === undefined) {
                return;
            }

            Utils.fitMapViewToWorldBoundingBox(dataInspector.mapView, boundingBox, dataInspector.mapControls);
        }
    );

    // Initialize intersection agent and UI widgets
    geoJsonDataSource.addEventListener(GeoJsonDataSource.EVENT_ATTACHED, () => {
        if (dataInspector.mapView !== undefined) {
            const intersectionAgent = new InteractiveIntersectionAgent(dataInspector.mapView);
            geoJsonDataSource.setUpIntersectionAgent(intersectionAgent);

            const uiContainer = document.querySelector(".row-container") as HTMLElement;
            Utils.installInfoWidgets(InfoPanel, geoJsonDataSource, uiContainer);
        }
    });

    return geoJsonDataSource;
}
To add tooltip and description, update the declaration of our geoJsonData object in index.ts:
const geoJsonData: FeatureCollection = {
    "type": "FeatureCollection",
    "features":
        [{
            "type": "Feature",
            "geometry": {
                "type": "Polygon",
                "coordinates": [
                    [
                        [114.169, 22.319],
                        [114.175, 22.308],
                        [114.185, 22.300],
                        [114.190, 22.306],
                        [114.185, 22.315],
                        [114.169, 22.319]
                    ]
                ]
            },
            "properties": {
                "tooltip": "Custom feature tooltip",
                "description": {
                    "Text": "Text value",
                    "Number": 42,
                    "Object": { a: "b" }
                }
            }
        }]
};
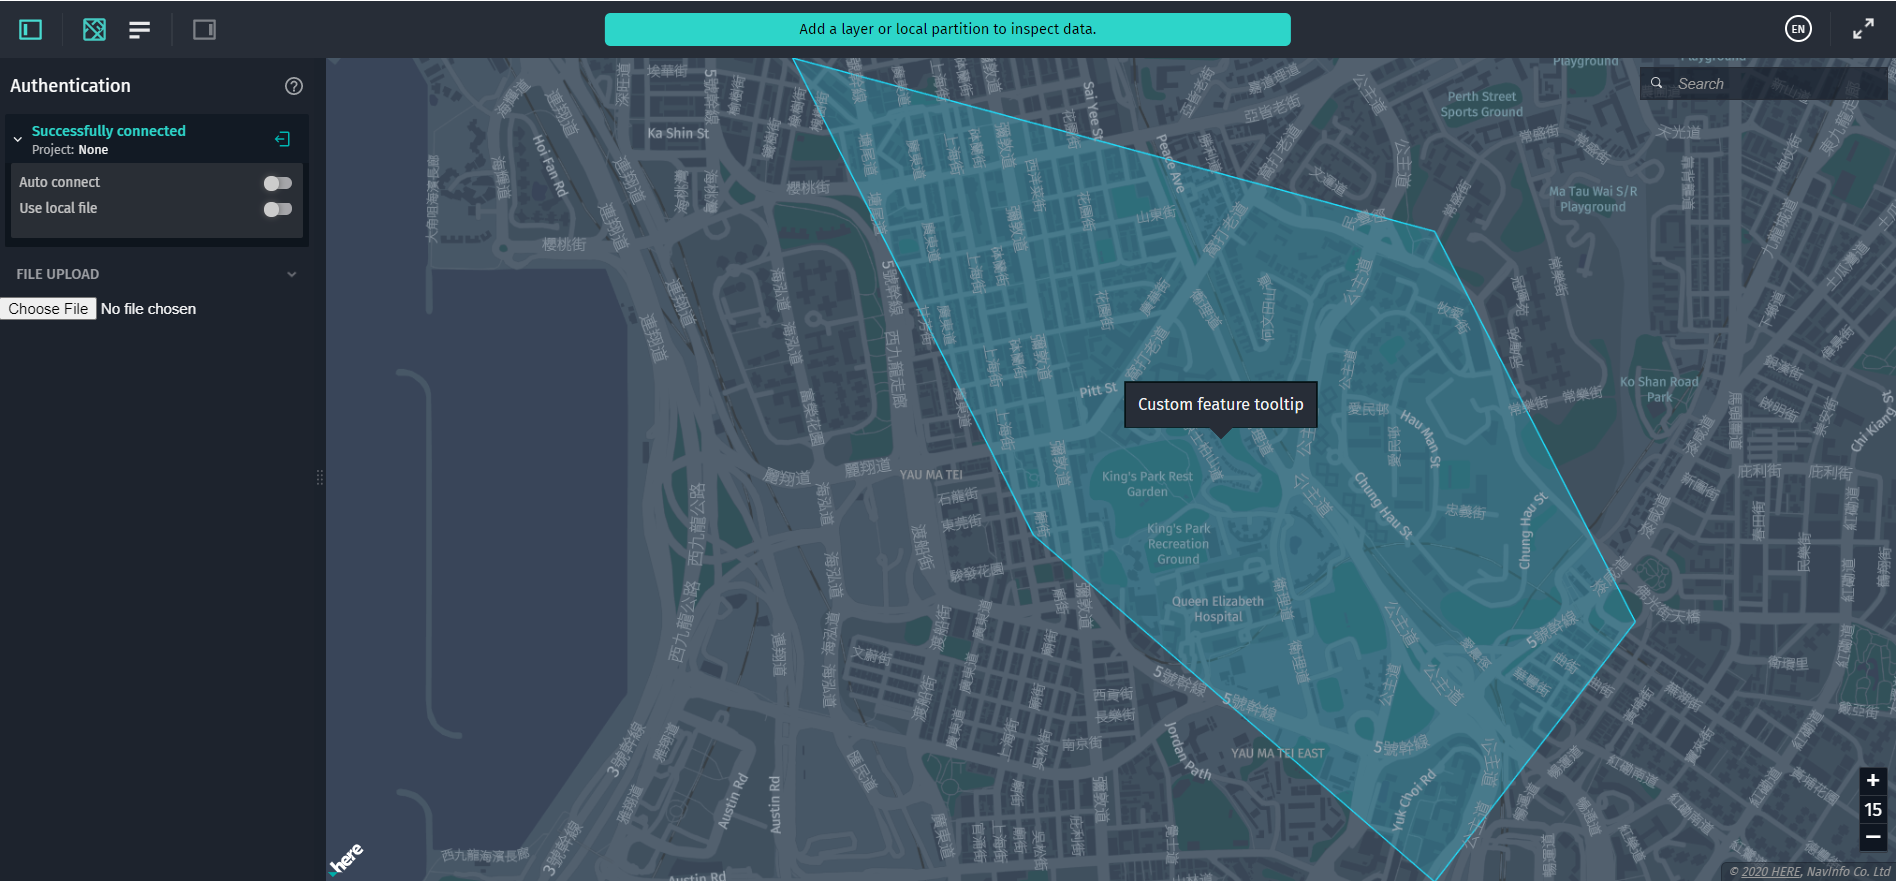
The data from the properties.tooltip member is displayed as a tooltip. This tooltip is rendered over the GeoJSON object and follows the movement of the mouse:
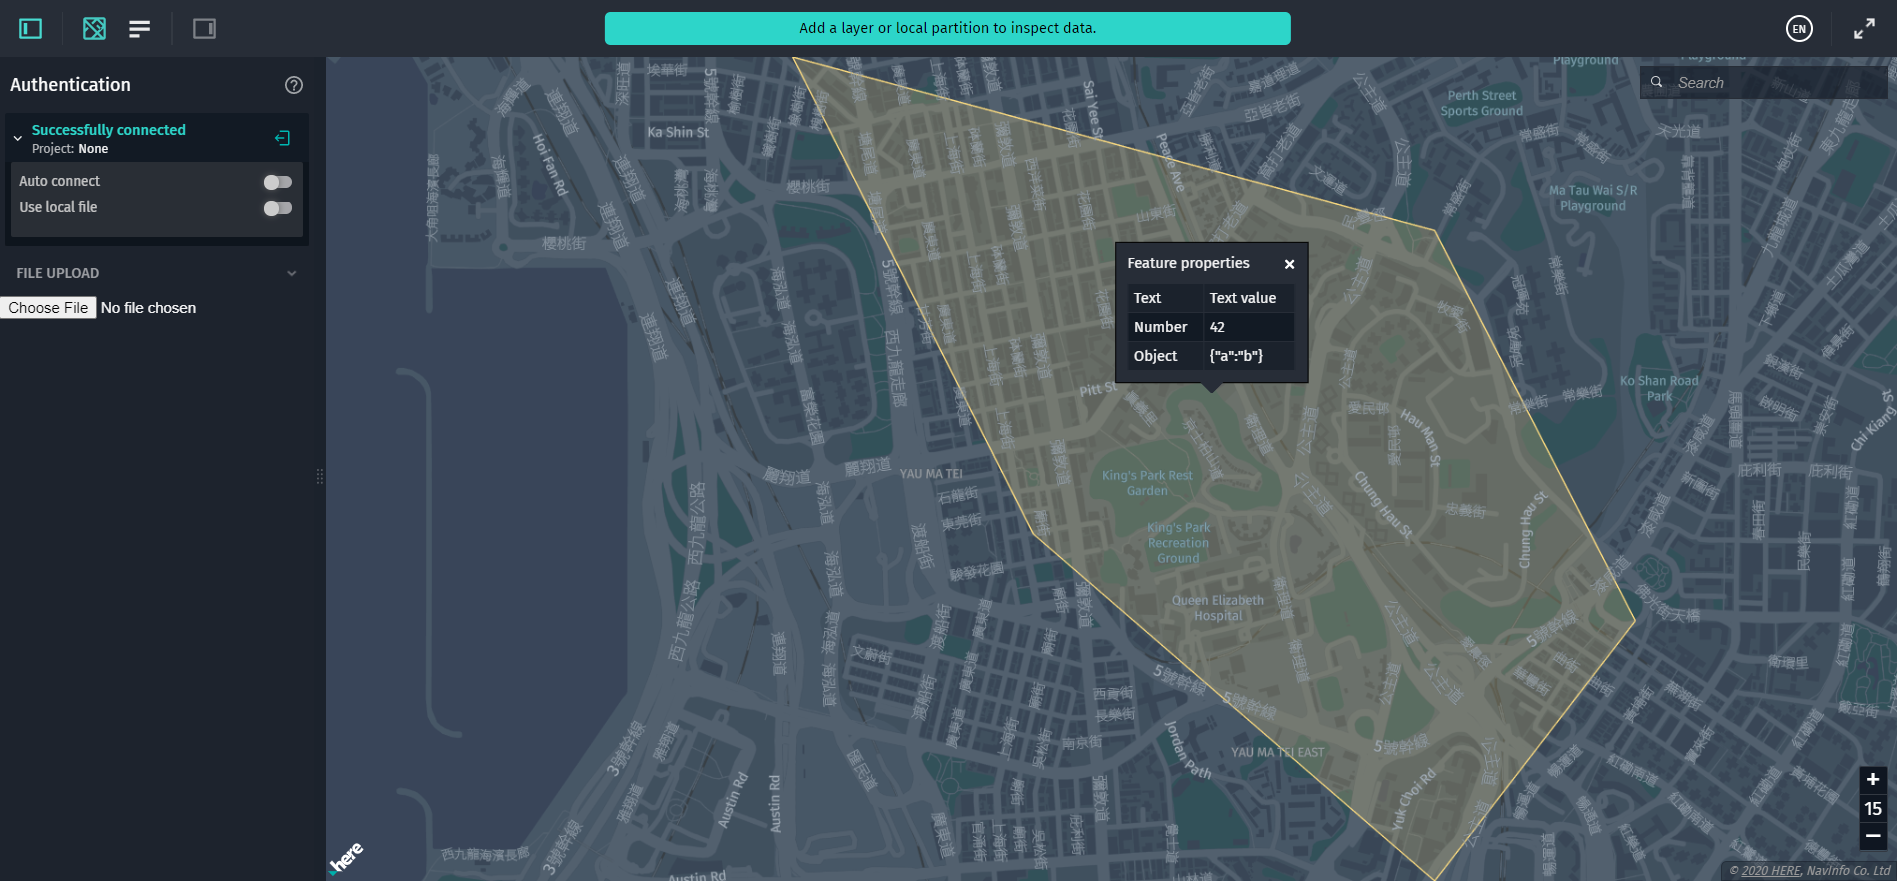
To display detailed information about the feature, you can use the properties.description property. It can be either an HTML string or (as shown in the sample code above) an object. When you click a GeoJSON feature to select it, this full feature description is shown in the informational panel:
Apply Custom Styles
To better visualize different data, you may want to change the default styles of the rendered GeoJSON object. To do this, add the following items to the properties of the geoJsonData object:
"properties": {
    "tooltip": "Custom feature tooltip",
    "description": {
        "Text": "Text value",
        "Number": 42,
        "Object": { a: "b" }
    },
    "stroke": "#00AA00",
    "stroke-width": 10,
    "fill": "#FFFF00",
    "fill-opacity": 1.0
}
This changes the fill color of the polygon to yellow (hex value #FFFF00) and the border color to green (hex value #00AA00). Also, the fill opacity is set to 1.0 (fully opaque) and border width is set to 10 pixels. For a full description of supported styles for GeoJSON features, see the Style GeoJSON Visualization chapter of this guide.
As a result, you should see the following shape rendered: 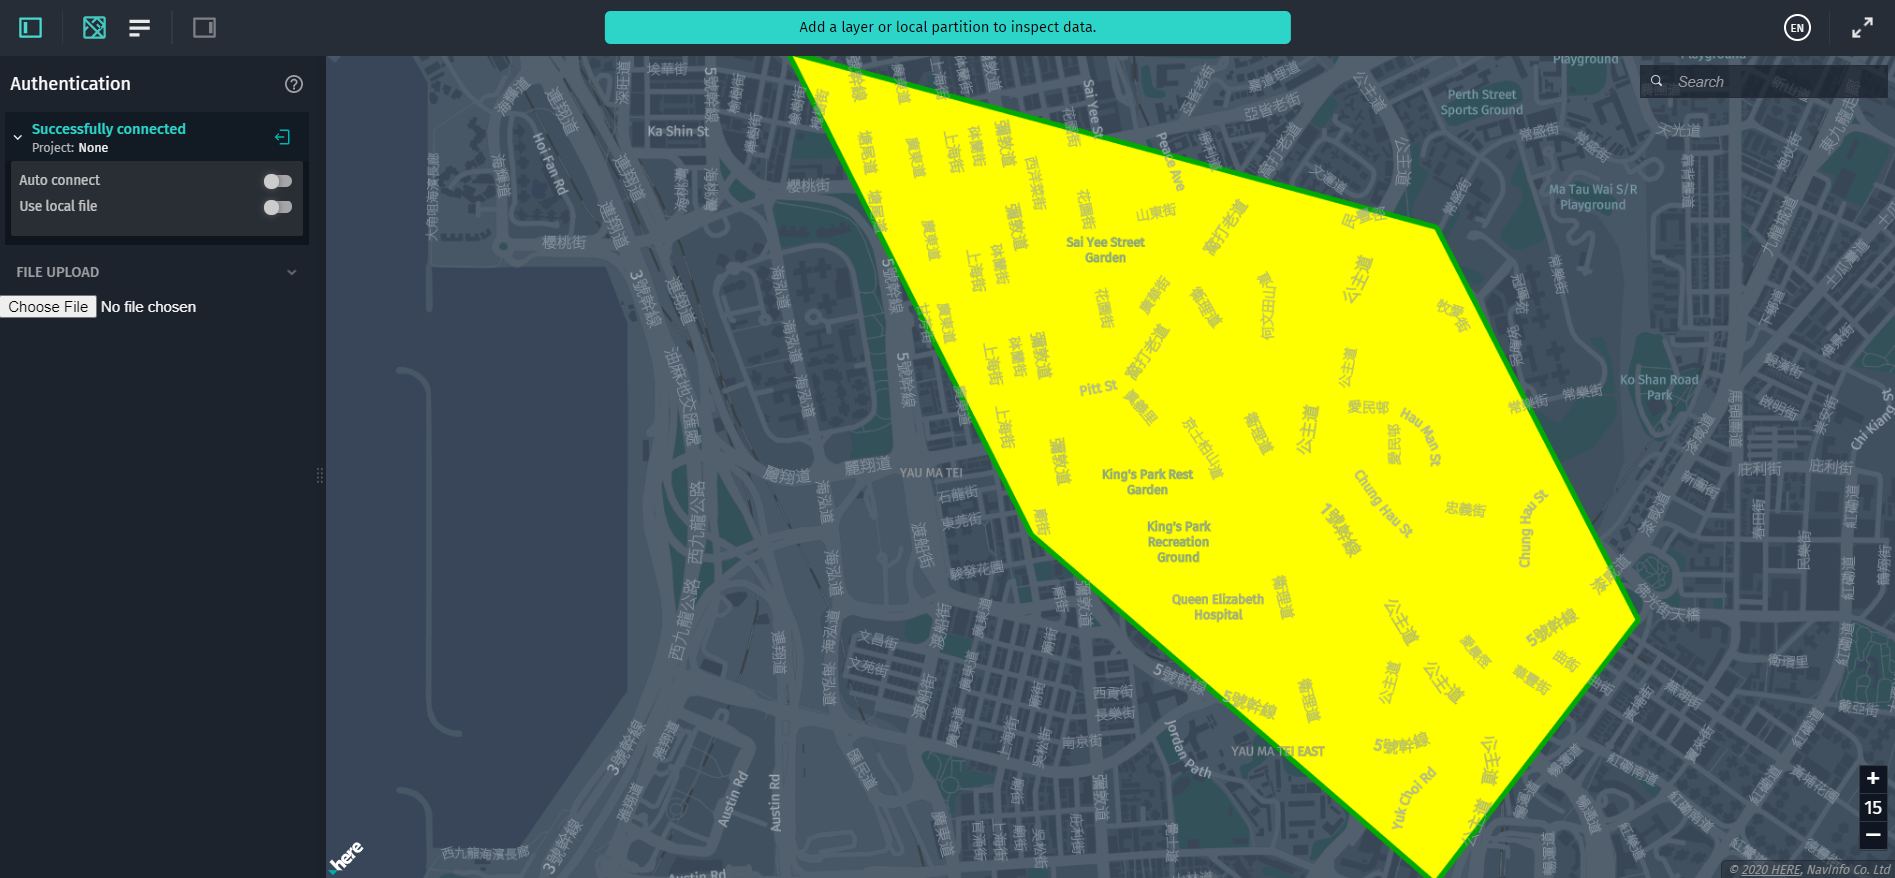
This concludes the basic tutorial on how to use GeoJsonDataSource to render static GeoJSON data.