- Products ProductsLocation Services
Solve complex location problems from geofencing to custom routing
PlatformCloud environments for location-centric solution development, data exchange and visualization
Tracking & PositioningFast and accurate tracking and positioning of people and devices, indoors or outdoors
APIs & SDKsEasy to use, scaleable and flexible tools to get going quickly
Developer EcosystemsAccess Location Services on your favorite developer platform ecosystem
- Documentation
- Pricing
- Resources ResourcesTutorials TutorialsExamples ExamplesBlog & Release Announcements Blog & Release AnnouncementsChangelog ChangelogDeveloper Newsletter Developer NewsletterKnowledge Base Knowledge BaseFeature List Feature ListSupport Plans Support PlansSystem Status System StatusLocation Services Coverage Information Location Services Coverage InformationSample Map Data for Students Sample Map Data for Students
SDII Data
Currently, the Data Inspector Library visualizes the Sensor Data Ingestion Interface (SDII) data stored in the HERE platform through:
- Dedicated GeoJSON rendering plugin that allows you to customize your visualizations as needed.
- Special
SdiiDataSourcedata source.
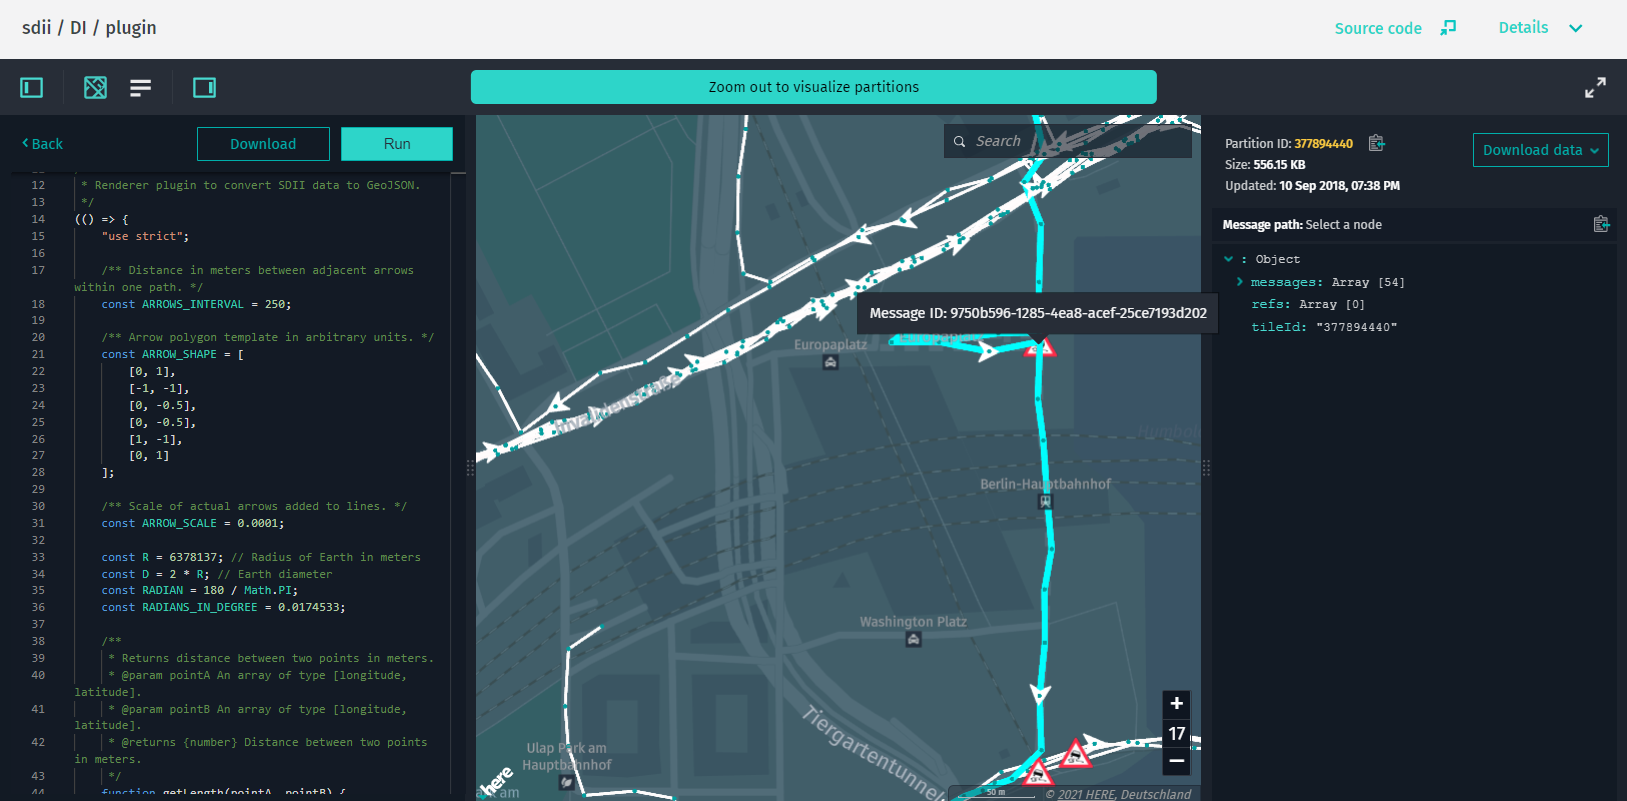
Visualization through Dedicated Plugin
By default, the dedicated rendering plugin for the SDII data is included in a layer's data schema. To see how it works, use the sdii / DI / plugin app that comes as part of Data Inspector Library examples.
Note
When using a local Data Inspector instance, keep in mind that if no rendering plugin is found in the connected data schemas of the layer with SDII data, the visualization automatically falls back to SdiiDataSource.
For more information on how to work with rendering plugins, see Create rendering plugins.
Visualization through SdiiDataSource
To visualize SDII data with SdiiDataSource, do the following:
-
Create an instance of
SdiiDataSourceand connect it toMapViewas follows:const sdiiDataSource = new SdiiDataSource({ dataProvider: new DataProvider({ hrn: "HRN string", layer: "Layer ID where data is stored", environment: "here", getToken: async () => "Your Token" }) }); mapView.addDataSource(sdiiDataSource); -
Then, to visualize the SDII data for a certain tile, call the
selectTilemethod as follows:sdiiDataSource.selectTile(tileMortonCode);
Optional Parameters
You can provide additional parameters to the SdiiDataSource constructor to alter the default behavior of the datasource instance:
-
enableAnimation { boolean }: This option switches the animation of SDII messages on or off. -
animationAgent { AnimationAgent }: An instance ofAnimationAgentto control an animation of SDII messages. Must be used withenableAnimation: true. -
simulationPortion { number }: Animate messages one-by-one, instead of all at once. -
enableSignsTexture { boolean }:SdiiDataSourcecan visualize road signs in two ways - either as colored dots representing only the sign's permanency type (static, variable, or deactivated) or as an icon with an actual road sign image (stop signs, speed limit signs, and more). The same applies for other types of icons.-
enableSignsTexture: true: A texture is used to represent path events. -
enableSignsTexture: false: Path events are displayed as colored dots.
-
-
intersectionAgent { InteractiveIntersectionAgent }: An instance ofInteractiveIntersectionAgentthat fires events when an intersection with a geometry object happens or changes. Use it to set custom handlers for mouse-over events or clicks registered on SDII messages.
Example App
Before you can visualize SDII data, you need to know the HERE Resource Name (HRN) of the layer that contains the data. You can find the HRN of the necessary catalog in the Data section of the portal.
To visualize SDII data from a catalog, follow these steps:
-
Install the web app generator and enter your application name when prompted.
-
Select
SDII datawhen promptedWhat kind of data will you visualize on top of the Base map?.SDII datais the default option, so you can also press Enter. -
When prompted
HRN of the Catalog you want to visualize?, enter the HRN of the catalog that contains SDII data. -
When prompted
Name of the layer you want to visualize?, enter the name of the layer that contains SDII data. -
When prompted
On which level the data is stored?, enter the minimum zoom level that is required for the data to render. -
Once the code is generated, you can build and serve the web app by running the following command:
npm run start -
Next, open
http://localhost:8080in your favorite web browser to see the generated app.To see the base map, update the authentication form with the credentials that you obtained from the platform portal.